Product Performance Report
What is the Product Performance Report?
The Product Performance Report is a hybrid between a sales report and an inventory on hand report. It allows you to compare your inventory data for a product with sales data such as item's sold per month, cost of goods and revenue.
Note: Composite products are not included in the Product Performance Report. If a composite product is sold, it will not reflect in the Product Performance Report either by the composite or by its component products.
What sort of information can I find in the Product Performance Report:
Because the Product Performance Report combines sales data with inventory measures, it can be an incredibly useful tool for future inventory planning. Below are some examples of the sort of information you can expect to get from the Product Performance Report:
Seasonal/Brand Performance
If you manage seasonal stock, the Product Performance Report is a great way of seeing how certain brands and types are performing in your store. By enabling the Brand and Type options in the product attributes drop-down arrow on the left you will be able to see the sales and inventory data for these brands and get some further clarity around brand success.
Note: You can't look back at previous seasonal performance just yet, but historical data will be added soon.
Individual Product Performance
The Product Performance Report can also be useful in drilling down to product specific data. By enabling the SKU option in the product attributes drop-down arrow on the left you will be able to look at sales and inventory data for individual products and get a better idea of how these products are selling, how much they have cost you and how much revenue they've brought in to date.
Product Popularity
It's good to see how much a certain item has sold and comparing this information alongside inventory data is even better. Sometimes, though, this data alone isn't quite enough when analysing your store's performance. This is where reporting measures step in.
By adding different measures (accessed using the drop-down arrow on the far right of the report) you can surface a range of additional sales and inventory information. Two good measures to try are Return % and Discount %. By matching Items Sold against Return % and/or Discount % you'll be able to see how many of these items were returned or heavily discounted. This will give you a better indication of the product's popularity. If for example, a large portion of a product's sales were discounted or returned, it may mean that these products weren't as popular as others, even if all the stock was sold.
Products That Haven't Sold
Sometimes you might like to see which products haven't sold at all since they were first ordered. To do this, run the Product Performance Report and navigate to the First Sale column. If fields underneath this column are blank, it means the product has never been sold.
Customise your Product Performance Report:
A range of different product attributes and measures can be added to your report to help you get the most out of your sales and inventory data.
Date Range:
By default, your product performance report will show all time product data. If you would like to filter your product performance report by a custom range, select 'Date Range' from the date dropdown and pick your 'to' and 'from' dates:
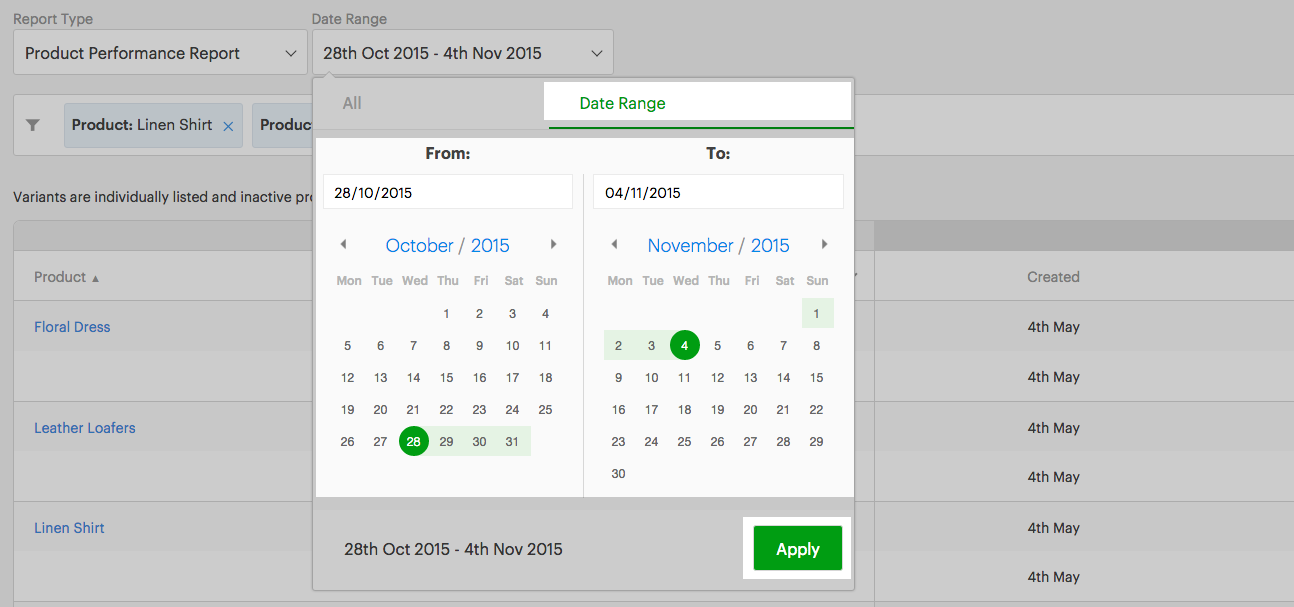
This will generate a custom report for your selected date range.
Product Attributes:
To access the products attribute selector, click on the down arrow located on the left-hand side of the report. Under here, you will see some product details you can choose to include in your report such as the SKU, Supplier Code, Brand, Supplier, Type and Tag.
Measures:
By default, your report will include a number of measures. These are:
- Created: The date this product was first added to your Vend store.
- Stock On Hand: The current available inventory total for this product.
- First Sale: The first time this product was sold in your Vend store.
- Last Sale: The last time this product was sold in your Vend store.
- Items Sold: The amount of times this product has been sold in your Vend store.
- Items Sold Per Month: The average number of times this product was sold each month.
If you would like to get more data out of this report, you can use the measure dropdown on the top right of the report to add some additional measures. The options here include:
- Weeks Cover: The estimated number of weeks that your stock will last, based on current stock on hand & the number of items sold in the last 6 weeks. For more accurate results, we only calculate and display information if the item was created more than 7 days ago & at least one unit has been sold per week, over the last 6 weeks.
- Transaction Count: The total amount of sales that this product has been involved in. This gives you a different amount to the Items Sold measure as it only counts the number of times the product was sold, not the number of products that were sold.
- Return %: The portion of items sold, that have been returned via the Returns workflow.
- Discount %: The average discount percentage given on total sales value (excluding tax)
- Item Value: The average cost of a single product in your store.
- Stock Value: The total value of your stock for this item.
- Cost of Goods: The total cost of products sold since you began selling them in your store.
- Margin: The percentage of revenue that you keep as gross profit (calculated as the difference between item sale price and item supply cost)
- Revenue: The total value of these sold items since you began selling them in your store.
Related Articles
Reporting in Vend
This article includes: Creating a Report in Vend Report Groups Sales Reports Payment Reports Inventory Reports Gift Card Reports Store Credit Reports Tax Reports Report Types Measure Date Range Filters Advanced Reporting Options The Retail Dashboard ...Dashboard
About the Dashboard The Dashboard has been created to provide a quick overview of the performance of the business. It graphically shows key sets of data over three specific periods — by month to date, quarter to date or year to date. It also shows ...Add Sales Quotes
The Add Sales Quote page enables you to enter quote(s) for a customer. Quotes have their own unique prefix that can be accessed and edited from Settings | System | Prefixes. New quotes are assigned to the next available quote number. Sales orders ...Adding Sales Order
The Add Sales Order page enables you to enter sales orders for customers. This page provides you with the flexibility to edit sales orders at line level. If you want the ability to create multiple shipments, multiple invoices, and purchases, you ...Reorder Report
About Reorder Report The Reorder Report page enables you to view the availability of all of your products along with their associated Supplier - and with the relevant stock level information. This report is ideal to see if your stock is running low ...