Reporting in Vend
This article includes:
Vend Reporting Overview:
Vend's reporting allows you to deep-dive into your sales data so you can gain a better understanding of your business. Vend has basic reporting functions that are available to all retailers regardless of plan type. If you are on an Advanced or Multi-Outlet plan, you can make use of Vend's Advanced Reporting. With Vend's advanced reporting you will have access to advanced measures such as basket value and transaction count, product performance reports and more in-depth sales filters.
Below is a comparison graph that shows which areas of reporting are available on which plans:
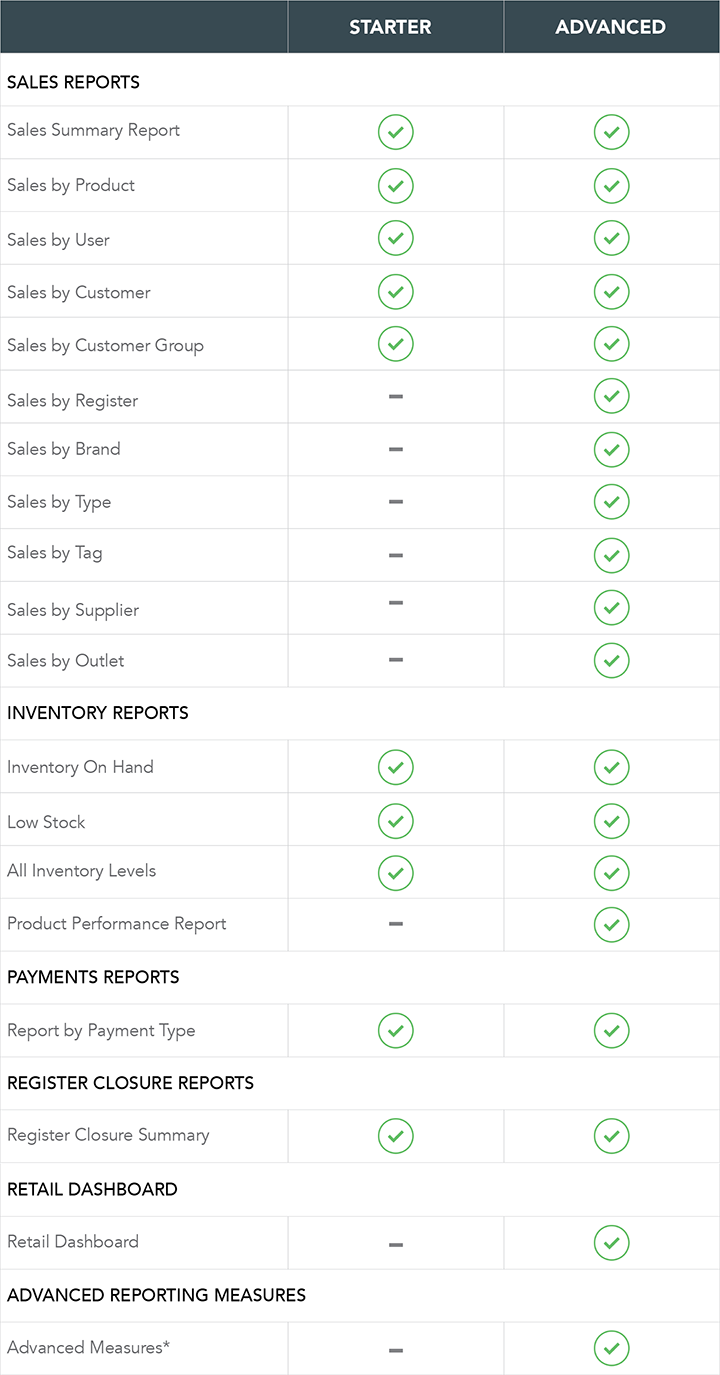
- For more information on the different advanced measures available, click here.
Creating a Report in Vend
Clicking on the 'Reporting' title in the menu bar will open the reporting dropdown.
Here you will have access to the Retail Dashboard, register closures and your sales, payment and inventory reports.
These reports will allow you to dig into your data to gain a deeper understanding of your business, getting answers to questions like 'which customers buy a specific brand the most?' and 'Which products from this supplier are the most profitable?'
To learn more about what options are available and find out how to create a report, follow the steps in the article below or check out our Reporting video guides at Vend University:
Report Group
To help choose the right report type to run you'll first want to select a report group. From the menu bar select either Sales Reports, Payment Reports or Inventory Reports.
Sales Reports
This report group contains all sales totals and product sales reports. If you are on one of our starter plans, you will have access to the:
- Sales Summary Report
- User Report
- Customer Report
- Customer Group
- Product Report
In addition to the basic reports above, advanced and multi-outlet retailers will also have access to:
- Outlet Report
- Register Report
- Brand Report
- Supplier Report
- Product Type Report
- Tag Report
Payment Reports
If you wish to report on payments made in your store, you can run one of the payment reports. The Payment Type report is currently the only option in this group.
Inventory Reports
Note: As of April 1st 2017, all historical inventory data has been stored. This means you will be able to run reports on your inventory at any point in time dating back to April 1st 2017.
You may also want to report on your store's inventory levels. Under the Inventory Reports group you have the option to report on your Inventory on Hand or All Inventory Levels.
If you are on an advanced or multi-outlet plan, you may also run a Product Performance Report. The Product Performance Report allows you to compare your inventory data for a product with sales data such as item's sold per month, cost of goods and revenue. To learn more about this report, click here.
What time of day does historical inventory reporting pull its data from?
Daily historical inventory reporting will pull its data from a 24 hour period starting at 12am each day. The time will be taken from your browser's timezone.
Gift Card Reports
Important: gift cards and gift card reports are only available to advanced and multi-outlet retailers.
Vend's Gift Card Reporting feature gives you a breakdown of your gift card totals for a quick overview of your gift card sales. It also contains a list of all gift cards sold allowing you to bring up a single gift card to view its current balance and redemption status.
If you want to learn more about this report and the kind of information you can get from it, check out this article here.
Store Credit Reports
Vend's Store Credit Reports feature gives you a breakdown of your Store Credit totals for a quick overview of the total store credit value issued, redeemed and outstanding. It also contains a list of all store credit issued and redeemed by your customers, allowing you to bring up customer information quickly to view their current store credit balance and redemption status.
If you want to learn more about this report and the kind of information you can get from it, check out this article here.
Tax Reports
Important: Tax Reports are only accessible to Admin users.
Vend's Tax Reporting gives you a per-tax-type breakdown of tax activity in your store. For each tax type, you can view the rate of the tax as well as the amount of tax taken and revenue earned for the date range you've specified. This report is particularly useful for reviewing monthly, quarterly or end of year financial information.
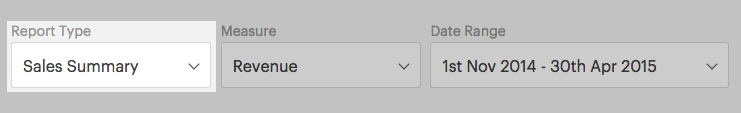
Report Type
Once you've chosen between Sales, Payment or Inventory reports you will then want to select the type of report to run:
Measure
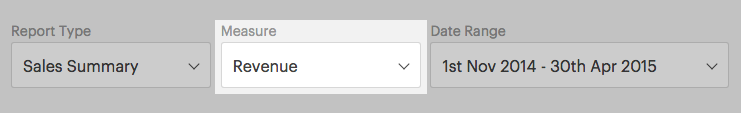
Once you have selected a report type, we will then need to pick how we are going to measure your information. You can use the Measure selector to choose what type of information to display. Some of these measures are only available to customers on advanced or multi-outlet plans.
The basic measures available to all retailers are:
- Cost of Goods: The total cost of products sold for that period
- Customer Count: Number of unique, registered customers served for the specified period
- Discount: Total amount discounted for that period.
- Gross profit: Total revenue in the specified period less the total cost of products sold for that period.
- Item Sold: Total number of items sold in the specified period.
- Items Sold Per Month: Average number of items sold per month
- Margin: The percentage of revenue that you keep as gross profit (calculated as the difference between item sale price and item supply cost)
- Return %: The portion of items sold, that were returned in the specified period.
- Return Count: Number of items returns in the specified period.
- Revenue: Total value of sold items in the specified period.
- Revenue (tax included): Total value of sold items in the specified period including sales tax.
- Sale Count: Total number of sales in the specified period.
- Tax: Total amount of tax charged on items in the specified period.
In addition to the basic measures above, advanced and multi-outlet retailers will also have access to:
- Basket Size: Average number of items per sale.
- Basket Value: Average transaction/sale value.
- Basket Value (tax included): Average transaction/sale value including sales tax.
- Discount %: Discount amount given on total sales amount (excluding tax)
- First Sale: Date the product was first sold.
- Last Sale: Date the product was last sold.
- Transaction Count: Total number of sales and returns in the specified period.
Date Range
We will also need to set the date range for this report. Here you have the option to either compare two dates using a set date range or specify your custom date range.
Compare Dates:
There are two parameters to set when using the 'compare dates' option:
- Comparison period
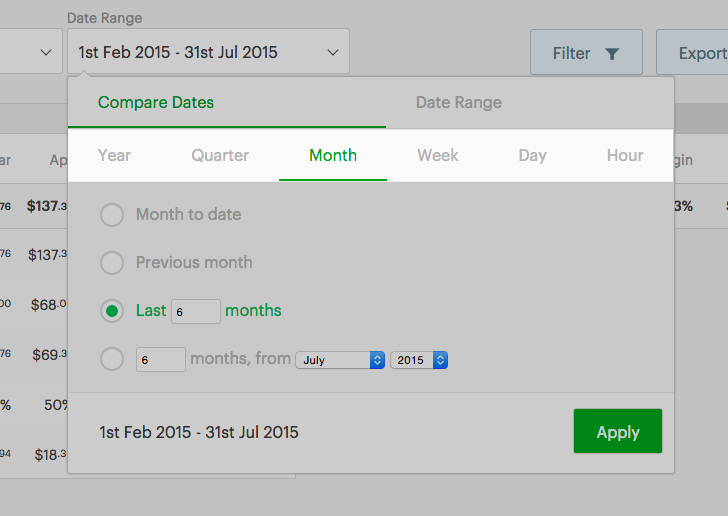
- Date range
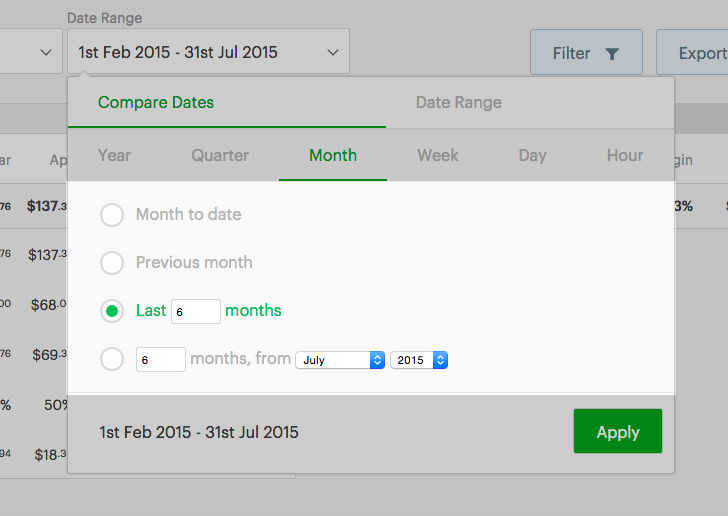
The following options are available for the comparison period:
- Year
- Quarter
- Month
- Week
- Day
- Hour
Once you have selected your comparison period, you can select the set date range. The following options are available:
- [comparison period] to date: e.g. year to date, or today's sales.
- Previous [comparison period]: e.g. last year, or yesterday.
- Last x [comparison period]: e.g. last two years, last ten days, last three weeks.
- x [comparison period], starting xx/xx/xxxx: e.g. 6 months, starting January 1, 2014.
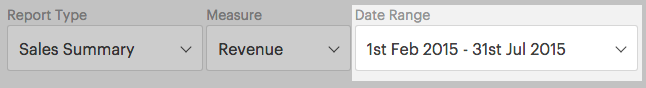
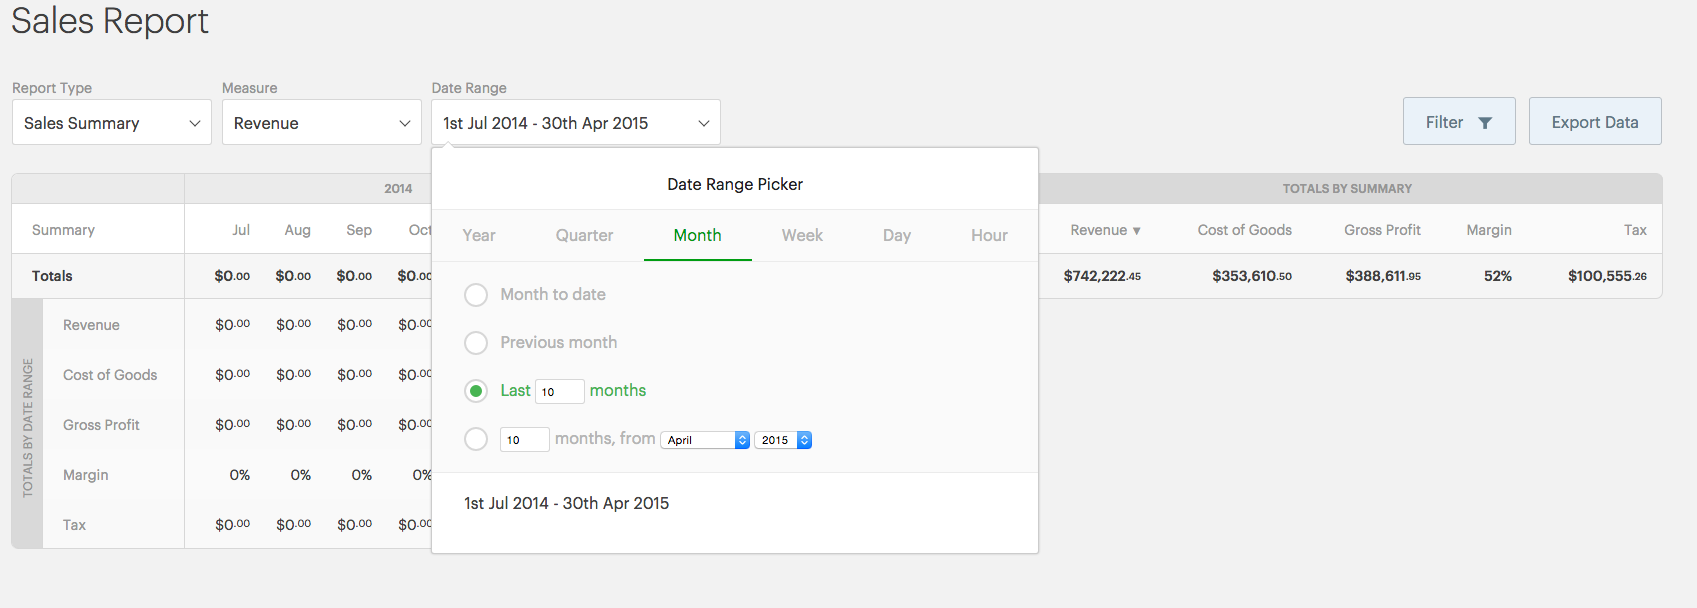
Custom Date Range:
If you would like to filter your reports by a custom range you can do this here. To do this, select 'Date Range' from the date dropdown:
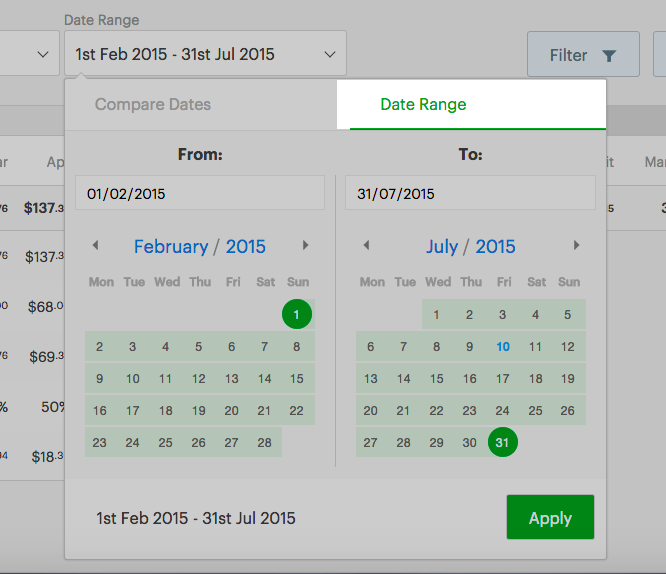
and pick your 'to' and 'from' dates:
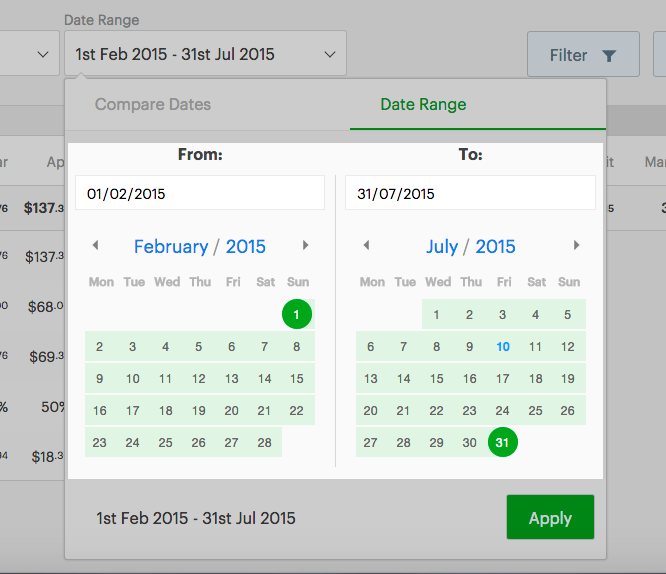
This will generate a custom report for your selected date range.
Filters
By now, you'll have a table displaying the data for your store. However, for many stores, this can be far too much data!
The filters bar can help you fine tune your data so you can dig deeper. The following filters can be used:
- Product Name
- Product SKU
- Product Type
- Product Tag
- Variant Attributes
- Customer (search by name or email address)
- Customer Group
- Outlet Name
- Supplier Name
- Brand Name
- Register
- User
Please note that not all these filters are available in Inventory and Payment reports.
Because you can add multiple filters, it's important to understand the way they work together.
Adding an extra filter of the same sort causes the filters to work as 'either/or'. For example: 'Supplier: Nike' 'Supplier: Adidas' will show you all products with either the supplier 'Nike' or 'Adidas'.
Adding an extra filter of a different sort causes the filters to work as 'and'. For example: 'Supplier: Nike' 'Type: Shoes' will only show you products sold with the supplier 'Nike' AND the type 'Shoes'.
You can keep adding filters - for example, adding a 'Supplier: Adidas' tag to the previous example would give you sales of Nike or Adidas shoes. If you then added a 'Type: T-shirt' tag, it would give you shoes or t-shirts supplier by Nike or Adidas.
Adding another filter tag within a category (for example, multiple suppliers, brands, or types) will give you MORE results, as it broadens the results you can see already.
Adding another filter tag in a new category (like adding a brand name to a supplier filter) will give you fewer results, as it restricts the results you can see already.
Additional Options
When running certain reports you may also see the option to tick "Show Products"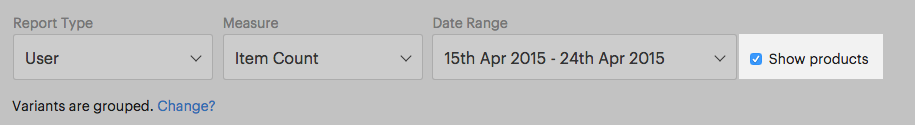
This option allows you to expand your reporting data to include products. For example, if you were to run a User Revenue report and select "Show Products" rather than just seeing the total revenue per user you'll be able to see a breakdown of the products sold by this user, the total revenue per user and the total product revenue for your specified period. This option will also group Variant products by default, but if you wish to view them ungrouped you can use the option below:
The Retail Dashboard
The Retail Dashboard is a feature available to those on Advanced and Multi-Outlet plans. The Retail Dashboard gives you a graphical snapshot of your store's metrics by day, week or month and allows you to navigate back through time periods to view historical store data.
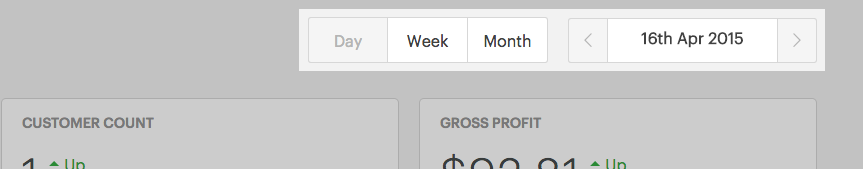
Date Picker
The date picker in the top right of the Retail dashboard gives you the option to review your daily, weekly and monthly store metrics. Additionally, you can use the date selector to scroll back in time and view your historical sales data.
Widgets
- Basket Size: Average number of items per sale
- Basket Value: Average revenue per sale (excluding tax)
- Discount %: Discount amount given on total sales amount (excluding tax)
- Discount: Total amount discounted for this period (excluding tax)
- Gross Profit: Total revenue less the cost of goods sold
- Customer Count: Number of unique, registered customers served in this period
- Sale Count: Number of sales in this period
- Revenue: Total income from items sold (excluding tax)
Tables
Products Sold: This shows you your top products as well as the number of times they were sold and the total amount they were discounted.
Top Sales People: This shows your top staff members. It provides the quantity of items sold by these sales people as well as their revenue earnings.
- * *
Exporting Reports
While reports can be viewed on Vend at anytime you may wish to customise, merge or manipulate this data by exporting it into a spreadsheet.
To do this click on the Export Data button: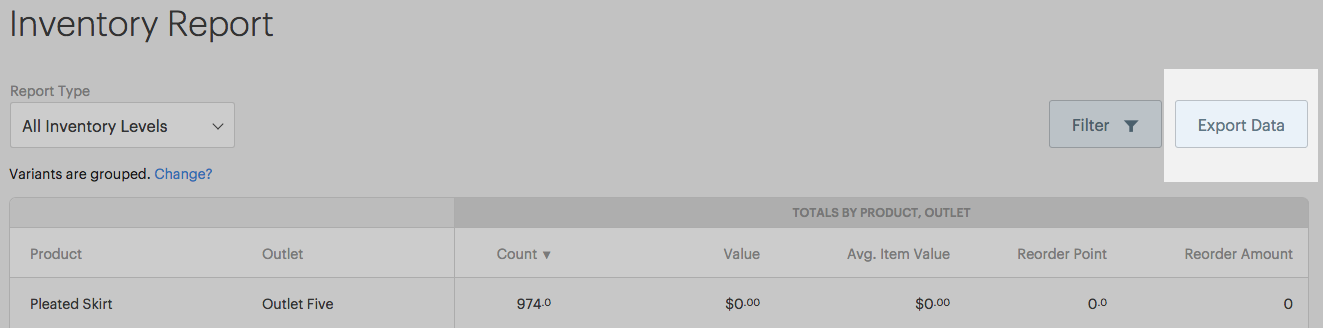
This will then download the report as a .CSV file that can be opened in a spreadsheet application such as Excel or OpenOffice
Below is a couple of suggestions on how to make the most of Vend Reporting's Export Datatool:
Comparing and Merging Reports
Comparing reports is easy when using the Export Data tool. Not only will you be able to look at multiple exported reports side by side but also merge these reports to benchmark their values against one another.
Keeping a Running Record of your Stock on Hand
While Vend Reporting doesn't cater for historical stock records at the moment, you may still want to keep a regular record of your stock on hand over a certain period. By frequently exporting Inventory on Hand reports you will be able to maintain a running record of your inventory levels.
Creating Customised Graphs
You can also look into using this exported data to create your graphs in your spreadsheet application. To learn how to do this in excel check out this article here.
Making the most of Vend Reporting
Important: Revenue from Layby Sales will not appear in reports until they are paid off and completed.
Vend's new Reporting system is both customizable and flexible making it a very powerful tool for managing your store. While you can attain all sorts of data from your store, below are some examples of the sort of information you can and might want to get from Vend Reporting:
Comparing product sales performance over a period
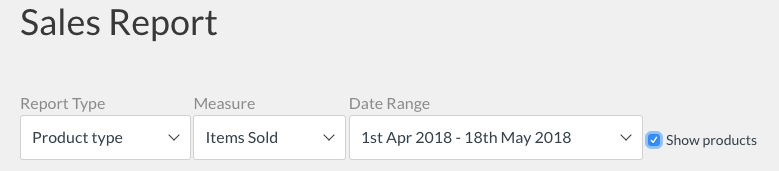
Report Group: Sales Reports
Report Type: Product Type
Measure: Item Count
Date Range: Based on the period you wish to view
Show Products: Ticked
Why run this report:
Running a report like this gives you an excellent insight into how well certain product groups are performing. Say, for example; you used types to specify seasonal stock and different product 'families', like men's clothing, women's clothing, and accessories. You can report on these 'families' and see how well each of these groupings is selling period by period and use the comparison to gain further insight into your top product groups.
TIP: When preparing for a busy season you may want to run a report like this for the same period in the quarter/year before. This can provide a clearer idea of your best sellers in the past and help you make informed buying decisions going forward.
Keeping track of your top sellers
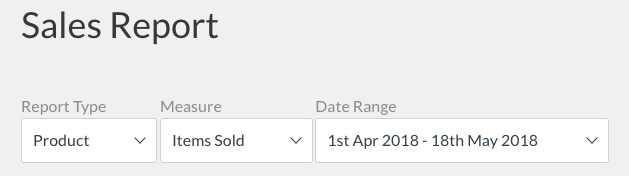
Report Group: Sales Reports
Report Type: Product
Measure: Item Count
Why run this report:
Not only does it show you which products are great sellers, but it also shows you your poor performers. This report can also be filtered by store and register, helping you identify potential areas for training, or products you may want to discontinue for a particular outlet or run a promotion for.
Measuring the performance of your staff
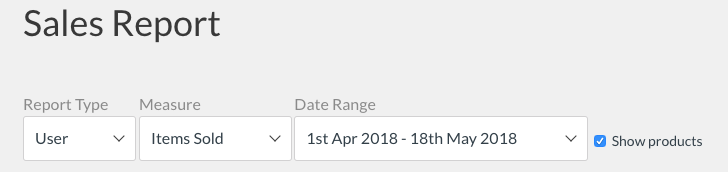
Report Group: Sales Reports
Report Type: User (If a user has not been given a display name they will only show as admin/manager/cashier.)
Measure: Item Count
Show Products: Ticked
Why run this report:
You can use this report for staff training and to help you performance manage your team. With this report, you will be able to view the number of products sold by the user, the products they sold and the total revenue earned by the user.
TIP: If you pay your staff commission you can use this report to see how much each staff member has sold and use it to help you calculate their bonus.
Getting a breakdown of daily totals over a period
Report Group: Sales Reports
Report Type: Sales Summary
Measure: Revenue
Date Range: Day --> Last __ Days
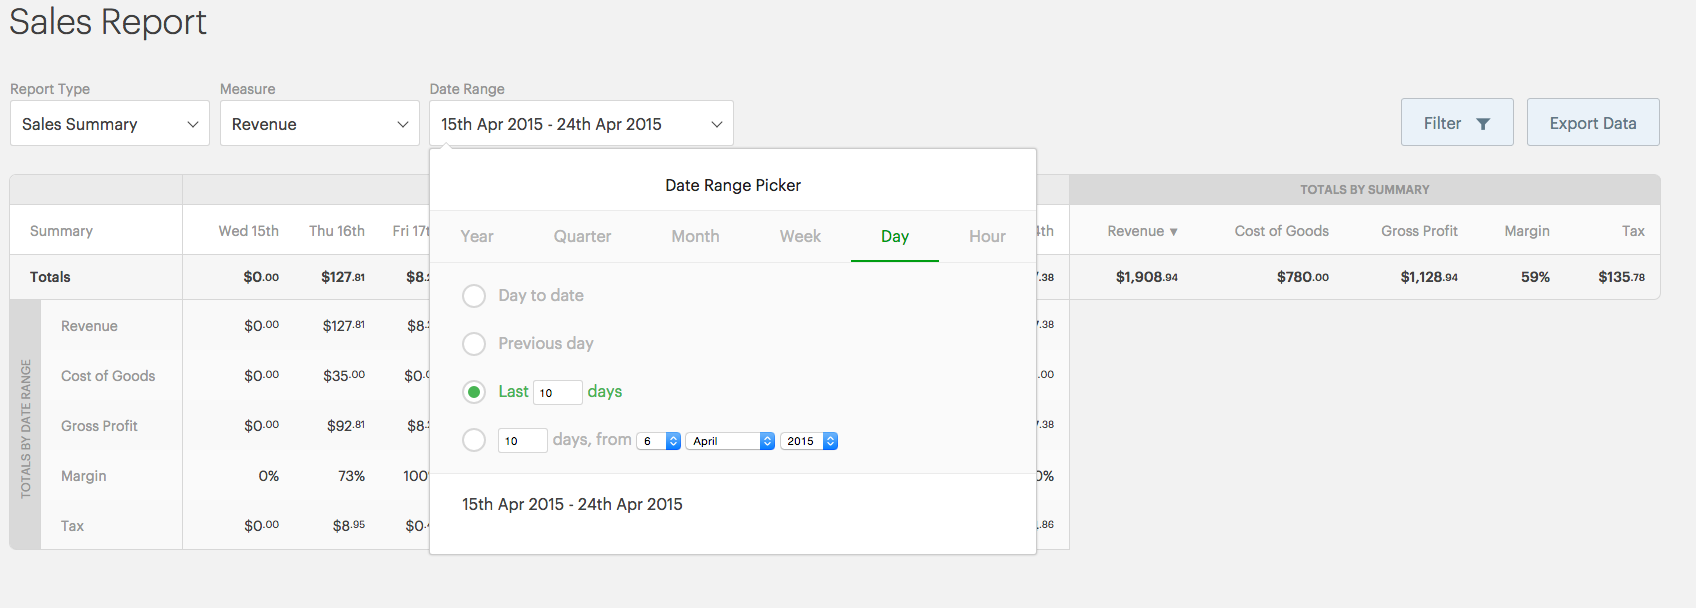
Why run this report:
This is an excellent report to run if you are looking to identify which days have a high or low turnover. It can also be used to easily track sales progress across a number of days, allowing you to compare daily sales performance.
Tracking your current stock levels
Report Group: Inventory Reports
Report Type: Inventory on Hand
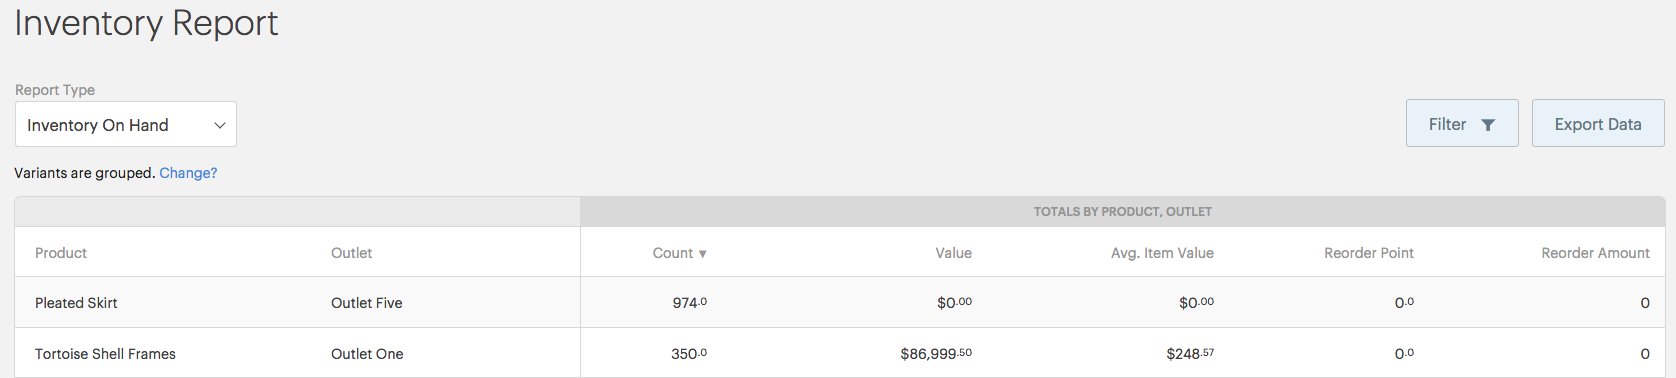
Why run this report:
Keeping track of your inventory is invaluable when monitoring your store's progress and this report can provide you with a simplified, product by product breakdown of your current stock levels. While this report only gives you your current stock on hand, you can regularly export it to keep a comparative record of your stock going forward.
Because Vend Reporting is extremely flexible, the reports listed here only represent a small amount of what's available. Now that you understand the kind of information that can be retrieved from Vend Reporting and how to customise them to your liking, you can get busy experimenting with other combinations!
Commonly Run Reports
Important: Revenue from Layby Sales will not appear in reports until they are paid off and completed.
Many of you may have grown accustomed to our old reporting feature and are wondering how to run some of your favourite reports in this new system. Below is a handful of our most popular reports from the old system and instructions on how to run the equivalent report in the new reporting:
Product Sales by Type
Equivalent Report
Report Group: Sales Reports
Report Type: Product Type
Measure: Item Count
Show Products: Ticked
This report gave you a breakdown of your product sales sorted by the types that are assigned to these products during the product set up.
To run the equivalent report navigate to Sales Reports and select Product Type from the Report Type drop-down. From the measure dropdown select Item Count and under date range, specify the period you wish to report on. We'll also want to make sure Show Products is ticked so we can see the products involved in this data.
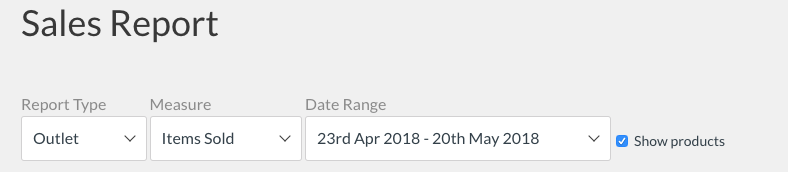
Product Sales by Outlet
Equivalent Report
Report Group: Sales Reports
Report Type: Outlet
Measure: Item Count
Show Products: Ticked
The 'Product Sales by Outlet' report showed you the data for all products sold for each outlet over the specified period, as well as a summary of the total sales for that outlet over the same period.
To run the equivalent report navigate to Sales Reports and select Outlet from the Report Type drop-down. From the measure dropdown select Item Count and under date range, specify the period you wish to report on. Show Products is ticked.
Product Sales by User
Equivalent Report
Report Group: Sales Reports
Report Type: User
Measure: Item Count
Show Products: Ticked
The 'Product Sales by User' report gave you an overview of the products each staff member sells the most of, as well as a summary of their overall sales.
To run the equivalent report navigate to Sales Reports and select User from the Report Type drop-down. From the measure dropdown select Item Count and under date range, specify the period you wish to report on. Show Products is ticked.
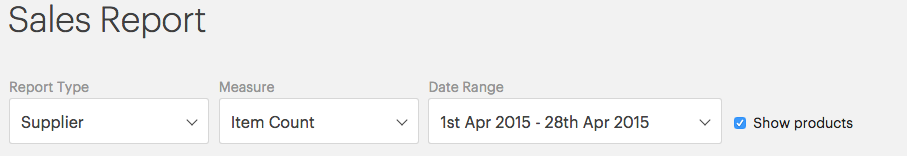
Product Sales by Supplier
Equivalent Report
Report Group: Sales Reports
Report Type: Supplier
Measure: Item Count
Show Products: Ticked
The 'Product Sales by Supplier' report gave you a product by product breakdown of sales sorted by a supplier and allowed you to compare your sales performance across multiple products and suppliers.
To run the equivalent report navigate to Sales Reports and select Supplier from the Report Type drop-down. From the measure dropdown select Item Count and under date range, specify the period you wish to report on. Show Products is ticked.
Sales by Day
Equivalent Report
Report Group: Sales Reports
Report Type: Sales Summary
Measure: Revenue
Date Range: Day -> Last __ Days
The 'Sales by Day' report gave you a breakdown of your total sales on a day by day basis and allowed you to compare your sales performance across multiple days.
To run the equivalent report navigate to Sales Reports, select Sales Summary from the Report Type drop-down and Revenue from the Measure drop-down. Under Date Range, select Day --> Last __ Days and specify the number of days you wish to include.
Sales by Month
Equivalent Report
Report Group: Sales Reports
Report Type: Sales Summary
Measure: Revenue
Date Range: Month -> Last __ Months
The 'Sales by Month' report gave you a breakdown of your total sales on a month by month basis and allowed you to compare your sales performance across these months.
To run the equivalent report navigate to Sales Reports, select Sales Summary from the Report Type drop-down and Revenue from the Measure drop-down. Under Date Range, select Month--> Last __ Months and specify the number of months you wish to include.
FAQ's
How do I run Stock Reports?
In the Vend menu navigate to Reporting > Inventory Reports. Under Report Types you will see the option to report on either Low Stock, All Inventory Levels or Inventory on Hand.
What happened to the 'My Sales' report for cashiers?
The "My Sales" report has been removed. Now, when viewing any sales report, a cashier will only see their sales and will not be able to view figures such as Cost of Goods, Gross Profit, and Margin.
How do I run the Register Closures report?
The Register Closures report has not been changed and can still be accessed in Vend Retail Manager via Reporting > Register Closures.
How do I run the Register Sales Detail report?
The Register Sales Detail report was essentially a dump of all sales for a period, with the register name listed (but without any grouping). This has been removed because it provided the same information as the Sales History screen. The Sales History screen can be accessed in Vend Retail Manager via the History menu entry.
How does Vend Reporting integrate with Vend Ecommerce?
Vend Ecommerce sales are recorded and reported on just like any other sale, with one exception - the sale is registered to the first "admin" user on the retailer's list of users.
Important:If a retailer wishes to distinguish their Ecommerce sales from the rest of their sales, they should first set up a separate Ecommerce register to record their sales.
Why can't I see all my products in the new Stock reports?
To run reports as fast as we can, we limit the data that is initially loaded. To display more data, click the "Load More Data..." button at the bottom of the report.
What does the number for Customer Count on my reports mean?
Customer Count is the total Number of unique customers that purchased something from you in the selected period. Currently, the WALK-IN customer counts as a single unique character. For example, if you perform ten anonymous (WALK-IN) sales, two sales to Joe, and 1 Sale to Adam this would result in a unique Customer Count of 3. One for WALK-IN, one for Joe and one for Adam.
What happens to my sales data after I have deleted a Register?
You will still be able to report on deleted registers in the new reporting. There will also be a visual indicator letting you know whether any register, outlet or product you are reporting on has been deleted.
Related Articles
Reporting on your Gift Cards
Vend's Gift Card Reporting feature gives you a breakdown of your gift card totals for a quick overview of your gift card sales. It also contains a list of all gift cards sold, allowing you to bring up a single gift card to view its current balance ...Roles in Vend
There are 3 types of user roles in Vend with different levels of permissions - Cashier: The cashier is a great user level to assign to your non-management staff. They are able to do things like process sales, transfer stock and ...Managing Variants in Vend
Product Variants are an important part of working with Vend for many retailers. Many products work best as variants. A blue t-shirt, for example, might have variants of Small, Medium, Large and X-Large. If you have questions about how to create ...Vend's Home Dashboard
What's New? Exploring the Home Dashboard Navigating to the Home Dashboard Filtering by Time Period Filtering by Outlets Filtering by Users Outlet Sales Sales Targets Products Sold Inventory Notifcations What's New? For those who have used the ...Activating, Billing, and Cancelling Vend
I want to activate my account Awesome! If you've made any trial sales before activating your account, you may want to delete these. Contact our Support Team for assistance completing this, so we can make sure you don't delete the wrong things ...