Retail Metrics on the Vend Retail Dashboard
If you are currently on a Vend store plan that has access to the Retail Dashboard, you will be able to take full advantage of a range of advanced retail metrics.
In addition to the Sales Performance section, you will have a choice of 9 different Retail Metrics that will appear under the 'Things to Know' section.
All upcoming or outstanding stock orders and inventory counts will also appear on the home dashboard, under the 'Things to Do' section.
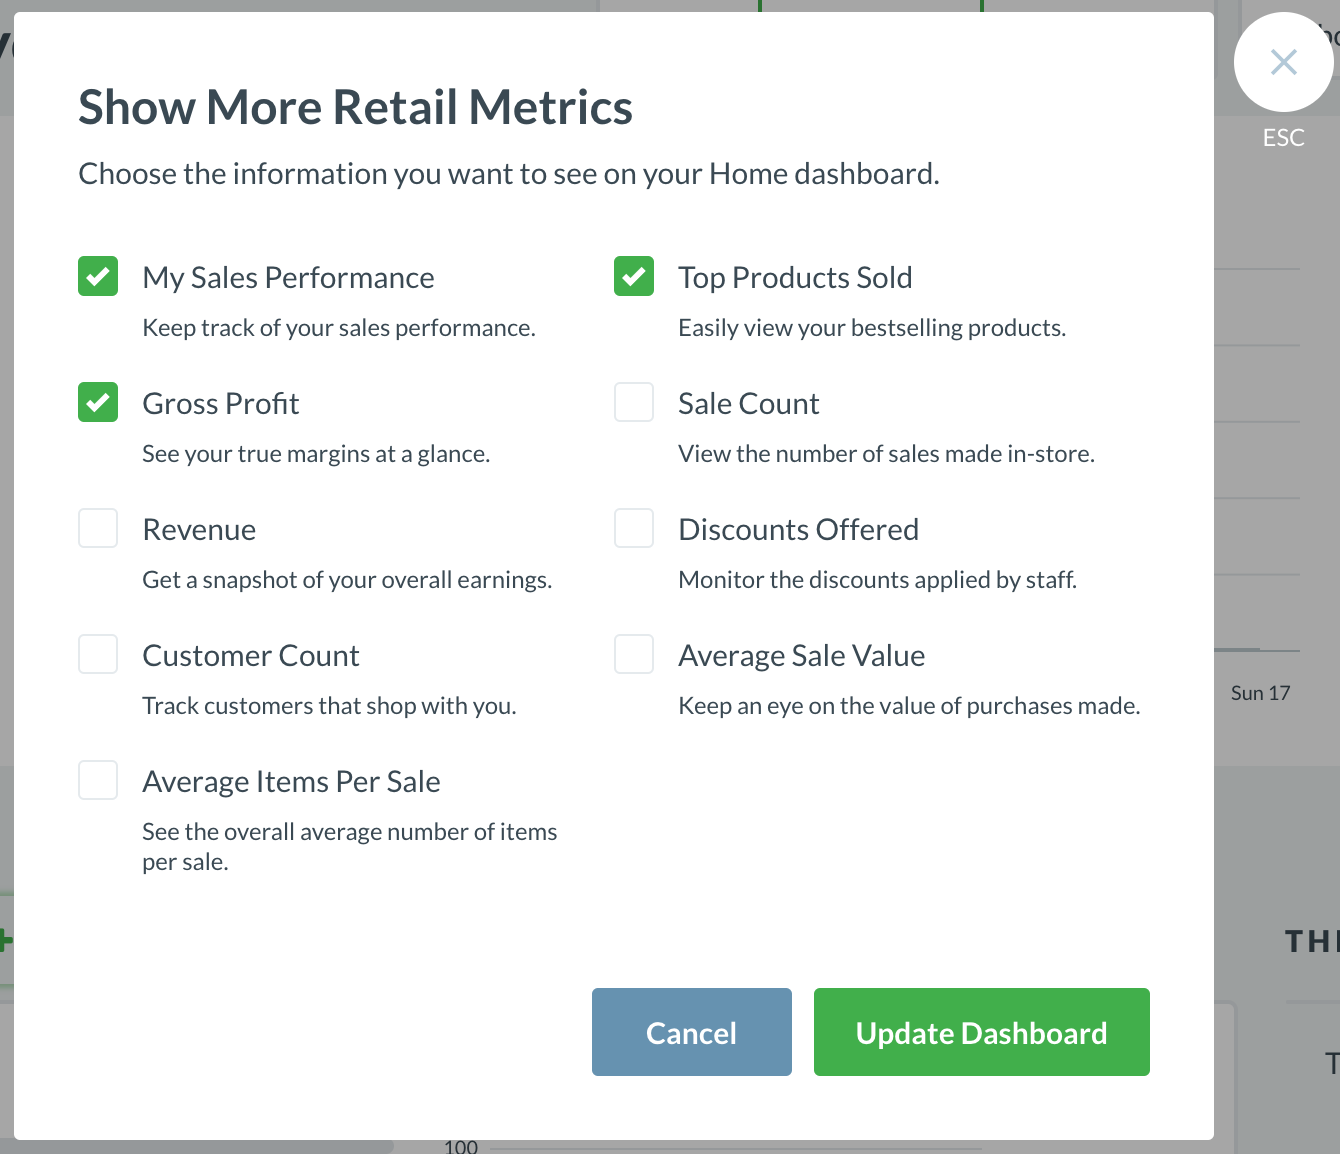
To add or remove Retail Metrics to your home dashboard, click the 'Show More Retail Metrics'button next to 'Things to Know'.

A window will appear where you may choose which information to show or hide on your home dashboard. To do this, tick or untick your chosen metrics and click 'Update Dashboard'.
What Metrics are Available:
My Sales Performance: This metric will let you see your personal sales performance. This can be useful if you want your cashiers and managers to track their sales on a daily, weekly or monthly basis.
Gross Profit: This metric will let you see your profit margins. This is calculated by taking your total revenue in a specified period and reducing it by the total cost of products sold for that same period.
Revenue: The Revenue metric will give you a daily, weekly or monthly snapshot of your overall earnings. If you have revenue targets, this can be a convenient way of quickly checking on your progress without having to delve too deep into further reports.
Customer Count: Enabling the Customer Count metric will allow you to track the number of customers that shop with you on a daily, weekly or monthly basis. When combined with sales data from the same period, This metric can become very useful when analysing your customer's shopping trends.
Average Items Per Sale: This metric will show you the overall average number of items that are sold in each sale. This is a simple but useful metric that will help you determine common purchasing practices of your customers (for example, whether it is normal for your customers to buy more than one product when shopping with you.)
Top Products Sold: This metric will give you a quick snapshot of the products in your store that have sold the most over a daily, weekly or monthly period.
Sale Count: The Sale Count metric lets you view the total number of sales made in-store; daily, weekly or monthly.
Discounts Offered: Enabling the Discounts Offered metric allows you to monitor the store discounts that are being applied by you and your staff.
Average Sale Value: Keep an eye on the value of purchases made.
Related Articles
Reporting in Vend
This article includes: Creating a Report in Vend Report Groups Sales Reports Payment Reports Inventory Reports Gift Card Reports Store Credit Reports Tax Reports Report Types Measure Date Range Filters Advanced Reporting Options The Retail Dashboard ...Dashboard
About the Dashboard The Dashboard has been created to provide a quick overview of the performance of the business. It graphically shows key sets of data over three specific periods — by month to date, quarter to date or year to date. It also shows ...Vend's Home Dashboard
What's New? Exploring the Home Dashboard Navigating to the Home Dashboard Filtering by Time Period Filtering by Outlets Filtering by Users Outlet Sales Sales Targets Products Sold Inventory Notifcations What's New? For those who have used the ...Adding widgets to your dashboard
Do you use third-party applications with Vend? With widgets you can add information from third-party apps to your Vend dashboard. Widgets appear as charts, graphs, calendars and lots of other useful formats, depending on the application. Widgets can ...Lightspeed Retail Front-End Handbook
LS Retail Front End Handbook