Vend's Home Dashboard
What's New?
For those who have used the existing Dashboard in Vend, we have made a number of improvements to the data on the Dashboard and the way it is displayed. Below is a list of what has changed and what you can expect with the new Home Dashboard:
Previously, the Dashboard would display rolling data for the last 7, 14 and 30 days. The new Home Dashboard will now display data for the current day, week and month.
You now have the ability to compare user and outlet performance by day, week and month, directly from the dashboard.
All data in the new Home Dashboard is pulled from our current reporting system, this way your data will be consistent and up-to-date between the Home Dashboard and Reporting.
The new Home Dashboard will now display tax inclusive figures for tax inclusive retailers and tax exclusive figures for tax exclusive retailers.
Important: The new Dashboard will not initially include custom widgets like Timely and Collect. If you are currently using custom widgets on your dashboard, you will remain on the old Dashboard for now.
Exploring the Home Dashboard
Navigating to the Home Dashboard:
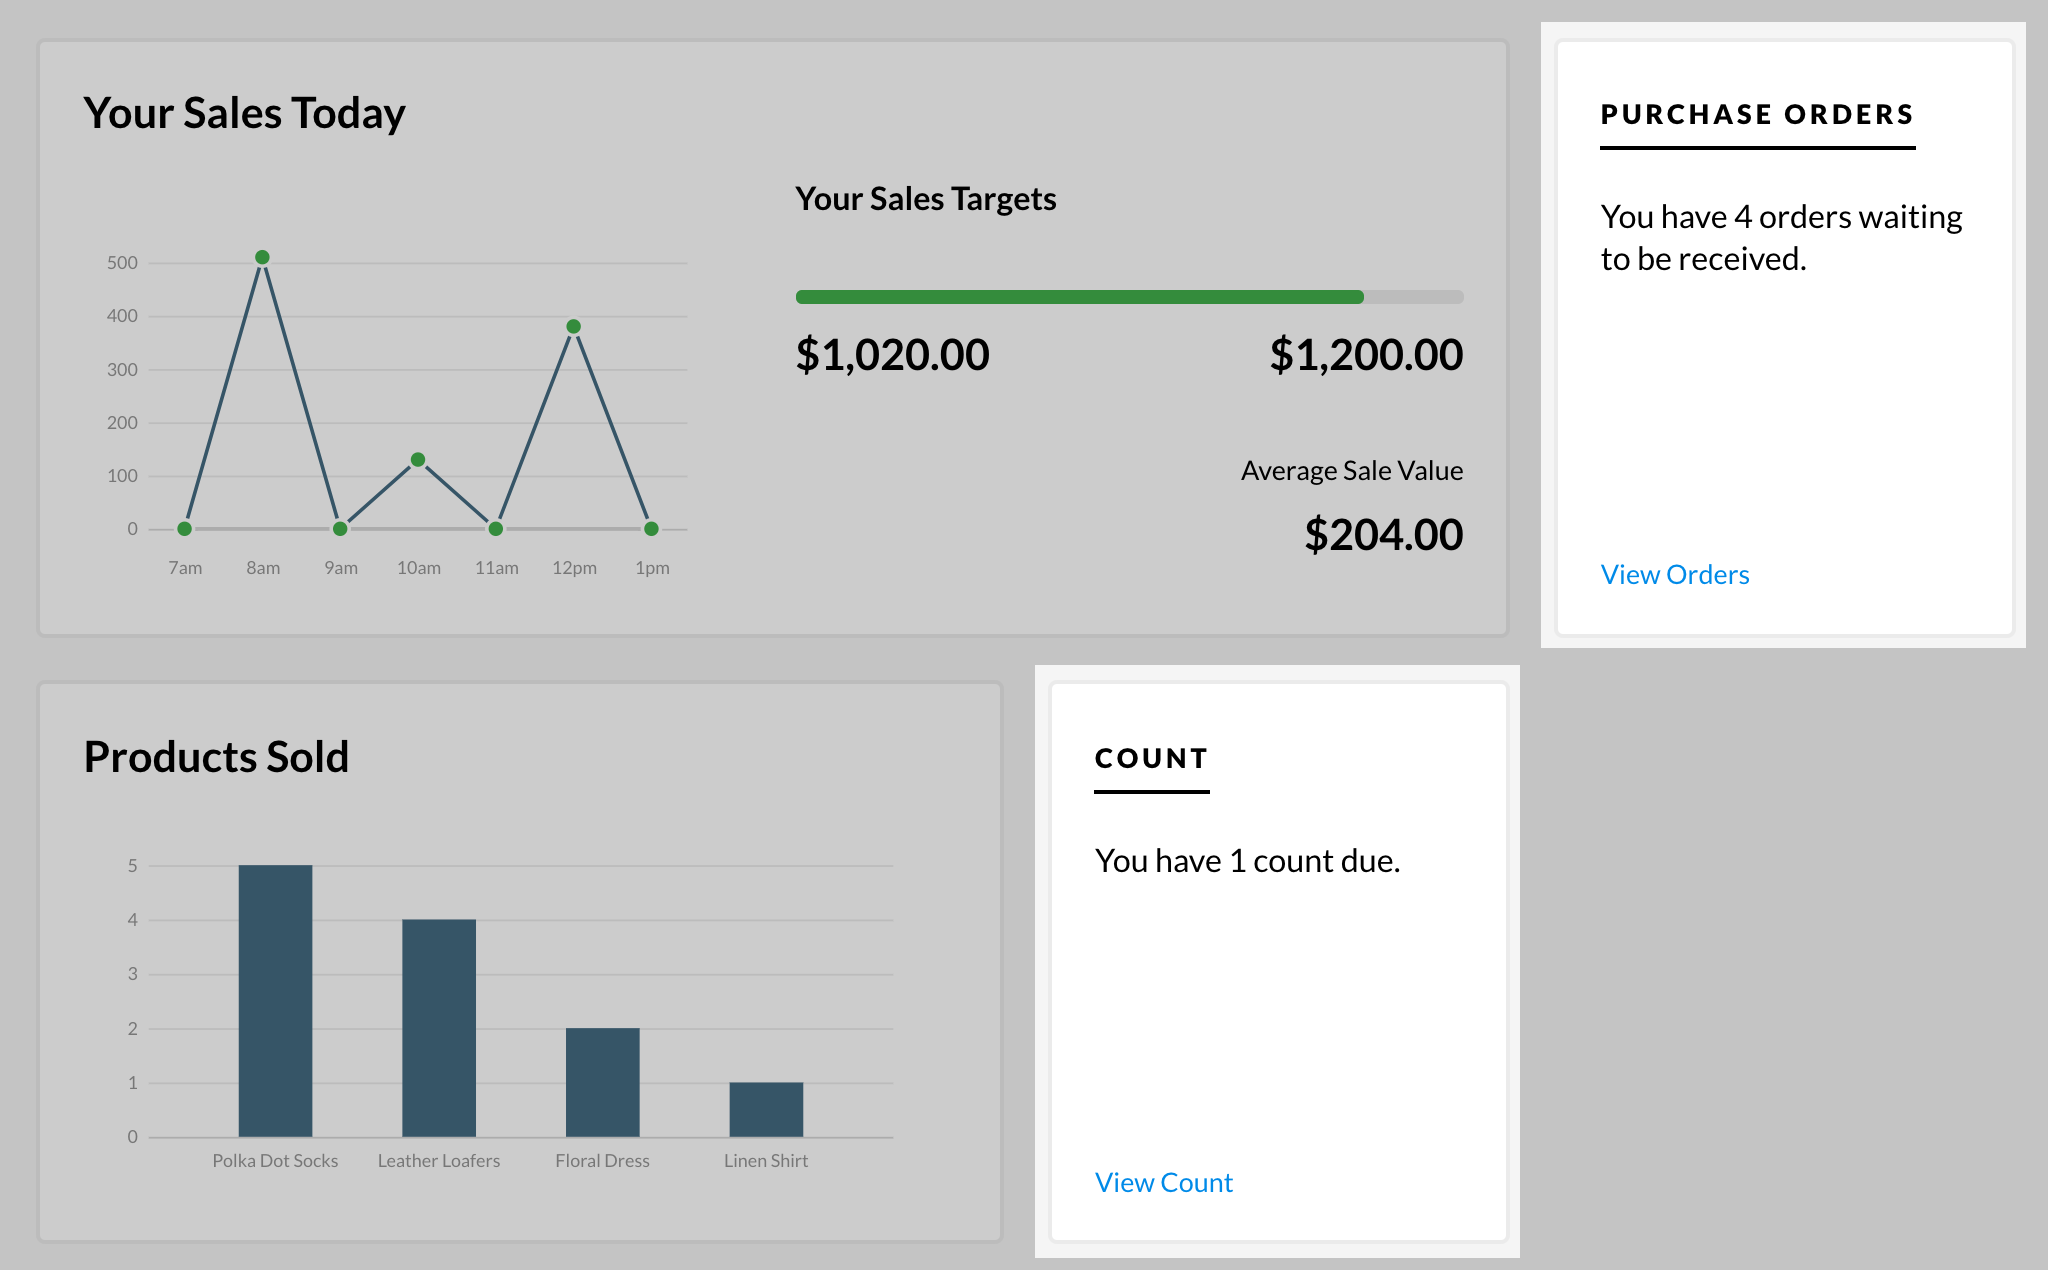
To find the Home Dashboard in Vend, click on the Home tab at the top of the left-hand sidebar. This will take you to your Home Dashboard where you can view your latest sales information, user targets and outstanding orders and inventory counts.
Filtering by Time Period:
To filter the information on your Home Dashboard by time period, select either day, week or month in the top left. This will show data from the month, week or day to date. For example, if today were Thursday and you selected week you would see sales reporting from Monday to Thursday of your current week.

Filtering by Outlets:
You can filter this data by outlet also. By default, the Home Dashboard will show all outlets if you are an admin or only the outlet's available to you if you are a manager or cashier user.

Filtering by Users:
To filter your Home Dashboard results by a user, navigate to the top right side of the screen and click the current user name.

From here you will be able to switch to another user in your system.
Outlet Sales:
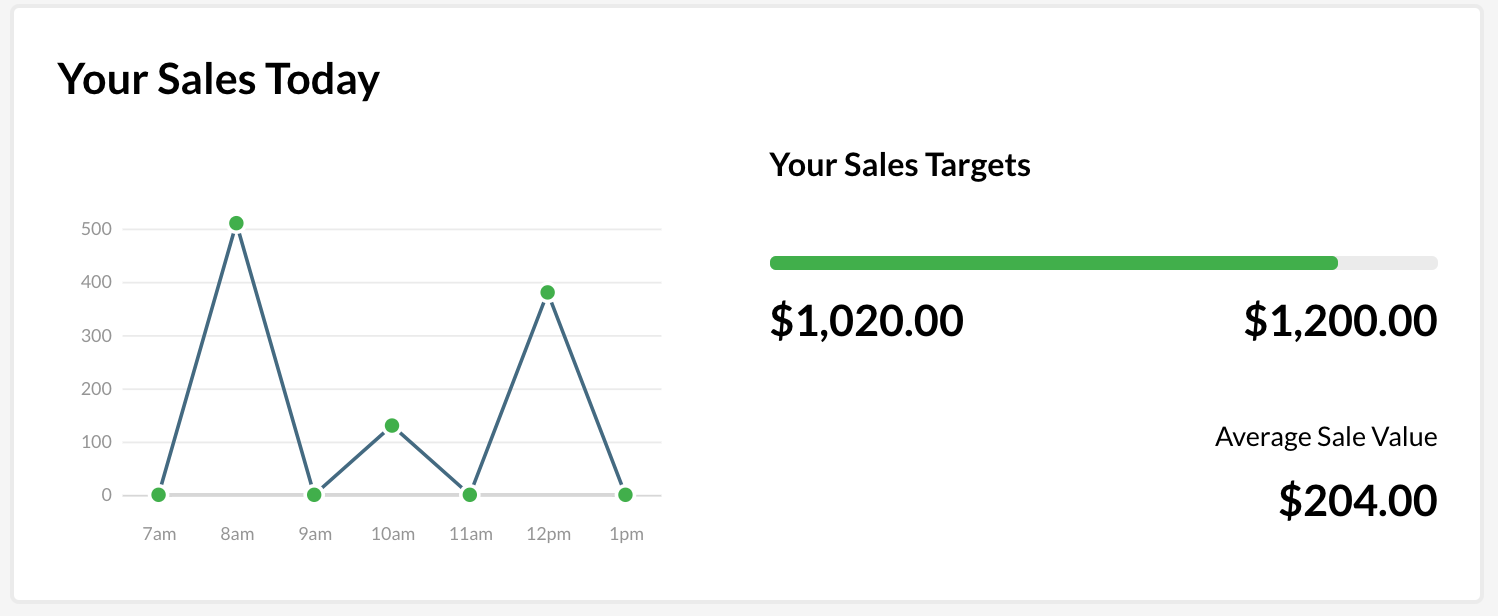
The first graph you will see on the Home Dashboard shows your store's sales for the time period and outlet(s) specified.

Important: Cashiers will not be able to view this graph and managers will only be able to view the stores they are associated with.
Sales Targets:
In the next section your Home Dashboard you will see the active user's sales and their sales target for the time period you have specified.

Products Sold:
The products sold graph will give you a weighted ranking of the products sold in your chosen outlet, during the time period you have specified.

Inventory Notifications:
If you have any sent purchase orders or sent outlet transfers waiting to be received or any due/overdue inventory counts in your store, you will be notified of this on your Home Dashboard.

Related Articles
Receipt Templates for the Vend Register iPad App
Receipt Template Sync for Vend Register on iPad What do I need to know if: I also use Vend on my Computer or used to use the old iPad app I've only ever used Vend Register How do I? Set up and edit my receipt template Create a new receipt template ...Retail Metrics on the Vend Retail Dashboard
If you are currently on a Vend store plan that has access to the Retail Dashboard, you will be able to take full advantage of a range of advanced retail metrics. In addition to the Sales Performance section, you will have a choice of 9 different ...Dashboard
About the Dashboard The Dashboard has been created to provide a quick overview of the performance of the business. It graphically shows key sets of data over three specific periods — by month to date, quarter to date or year to date. It also shows ...Adding widgets to your dashboard
Do you use third-party applications with Vend? With widgets you can add information from third-party apps to your Vend dashboard. Widgets appear as charts, graphs, calendars and lots of other useful formats, depending on the application. Widgets can ...Syncing inventory from multiple Vend stores with Shopify
When setting up Vend with Shopify, you can now combine and sync inventory from multiple Vend outlets and surface this on your Shopify store. You can select the inventory from one or more Vend outlets and make this available online for your customers ...